Kyoto University researchers treated roughly 1,200 satellites as a distributed sensor network, reconstructing thermospheric density tomographically and finding it consistent with ESA’s SWARM measurements.
The thermosphere is the part of the atmosphere that decides how long a satellite stays up. It runs from roughly 100 to 1,000 kilometres, it is more than 99 per cent neutral gas with less than 1 per cent ionised, and it is thin enough to be nearly vacuum and thick enough to drag spacecraft down. Its density swells and contracts with solar activity in ways that are difficult to predict, which is why conjunction warnings and re-entry forecasts carry the uncertainties they do.
Measuring it has always been the problem. There are few dedicated missions, they are expensive, and each one samples the single track it happens to be flying along. A study in Earth, Planets and Space from Kyoto University takes a different route: use the satellites that are already there, and whose orbits are published.
The corresponding author is Mamoru Yamamoto of Kyoto University.
Turning a constellation into an instrument
The method takes public Starlink orbital data and applies tomography, estimating the atmospheric density around roughly 1,200 satellites at 482 kilometres altitude. The output is a two-dimensional latitude–longitude snapshot of thermospheric density at about 500 kilometres.
The underlying physics is straightforward: a satellite in low orbit is continuously slowed by the gas it flies through, so the rate at which its orbit decays is a measurement of the local density. The difficulty has always been that one satellite gives one thin thread of data. A constellation of more than a thousand, distributed across every latitude and longitude at a common altitude, gives enough overlapping threads to solve for the field between them — which is what tomography does.
The result shows high consistency with observations from the European Space Agency’s SWARM mission, which carries accelerometers designed for this measurement. That comparison is the validation, and it is the right one, since agreement with a purpose-built instrument is what establishes that an inferred quantity is real.
The work also extends the team’s own earlier approach. The previous study used two-line element sets — the publicly distributed orbital descriptions tracked for every object in orbit — to estimate density as a function of time and altitude. This one adds the horizontal dimension, which is what the density of a particular constellation at a particular altitude makes possible.
A multidisciplinary argument
Yamamoto framed the contribution as much about the fields involved as about the measurement.
“This is a multidisciplinary study between space science and space engineering,” he said. “Reading papers from both research fields, we realized that deeper dialogue between researchers from both fields is necessary.”
That observation has substance behind it. Orbital mechanics and atmospheric physics have treated thermospheric density as opposite sides of the same equation for decades — engineers as a nuisance term to be modelled well enough to predict orbits, scientists as a geophysical quantity to be measured. The engineering side has accumulated an enormous archive of tracking data in the course of not studying the atmosphere, and this paper is an argument that the archive is a scientific instrument.
What it could support
The authors suggest the work could help reduce collision risks and may support near-real-time monitoring and space-weather forecasting.
Collision avoidance is where the value is most immediate. A conjunction warning is a probability calculated from two predicted positions, and the dominant error in a low-orbit prediction is uncertainty in atmospheric drag — which is uncertainty in density. Operators currently manoeuvre on warnings that are mostly false alarms, and each manoeuvre costs propellant and shortens a mission. Better density fields narrow the error ellipses directly.
Near-real-time monitoring is the more ambitious claim, and the mechanism is plausible: Starlink ephemerides are published continuously, so a pipeline that ingests them could in principle track the thermosphere’s response to a geomagnetic storm as it happens, which no existing observing system does with global coverage.
Why “initial report” is in the title
The paper calls itself an initial report, and the qualification is earned rather than modest.
What is presented is a snapshot: one two-dimensional map, at one altitude, at one time. The thermosphere’s interest lies almost entirely in how it changes — diurnally, with the solar cycle, and dramatically during geomagnetic storms — and a single map cannot demonstrate that the method captures any of that. Whether it can resolve a storm response is the test that would matter, and it has not been reported.
The validation is also described qualitatively. “High consistency” with SWARM is stated without a figure for the level of agreement, and for a method whose entire claim is that inferred densities are trustworthy, the quantitative comparison is the result. A reader cannot tell from the release whether the two agree within five per cent or within fifty.
Nor is the altitude coverage as broad as the thermosphere. The estimate is anchored at 482 kilometres because that is where these satellites fly, and density varies by orders of magnitude across the 100-to-1,000-kilometre range. A constellation gives excellent horizontal sampling at its own shell and nothing above or below it.
Then there is the dependence itself. The instrument is a commercial constellation whose operator chooses to publish ephemerides and could stop, alter their format or change their accuracy at any time, with no obligation to anyone’s research programme. That is a genuinely novel position for a geophysical observing system to be in, and the release does not raise it.
The paper was published on 30 July 2026. The research was supported by the Japan Society for the Promotion of Science, and the author declares no competing interests. The release names only the corresponding author and does not give a full author list.
Notes
- “Tomography of Thermospheric Density from Starlink Ephemeris: Initial report.” Earth, Planets and Space, 2026. DOI: 10.1186/s40623-026-02509-5.
- Kyoto University. “Mapping the upper atmosphere.” EurekAlert!, 4 August 2026. https://www.eurekalert.org/news-releases/1138729.
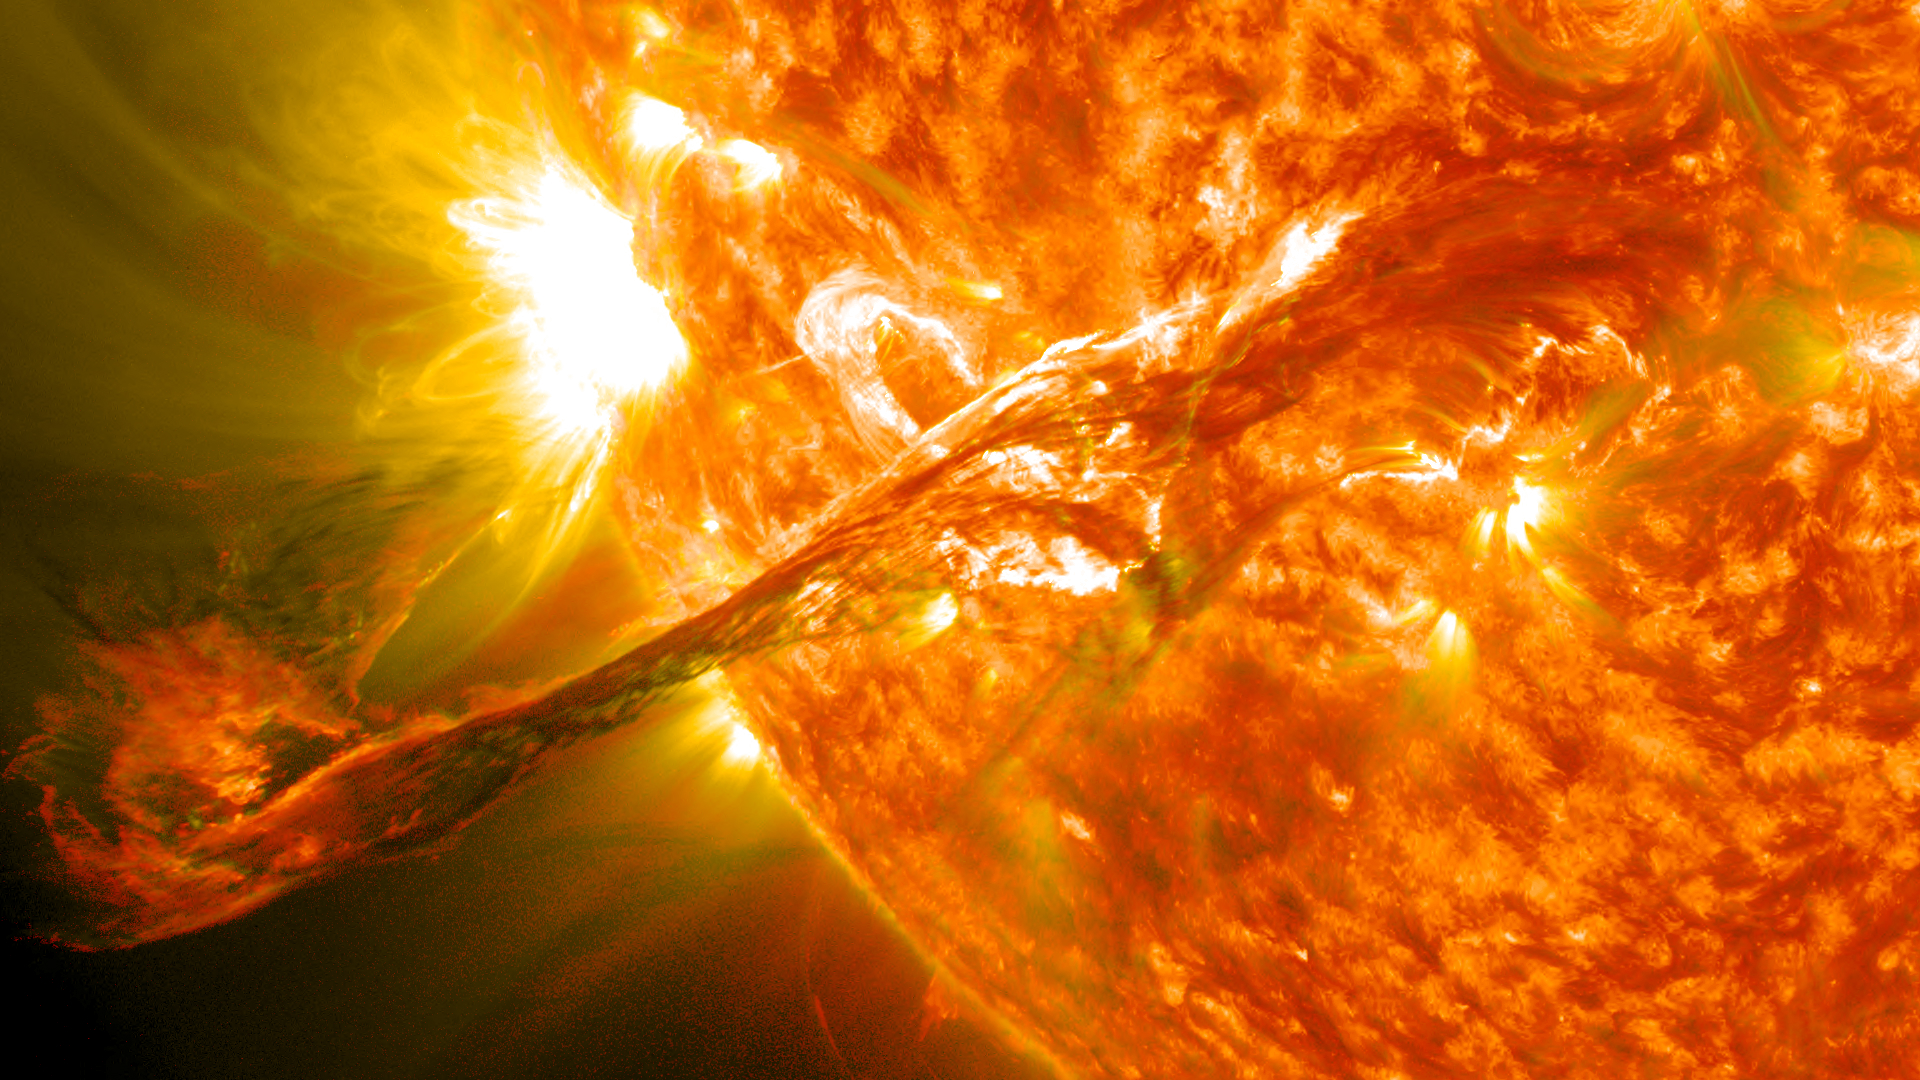
Photo by NASA/GSFC/SDO


Leave a Reply